


This is the last instalment of our three-part blog series, describing the tech side of how ustwo went about helping The Body Coach to expand and develop their business to become digital-first with an award-winning app. Find the other parts here: Part 1, Part 2
Adding queues
As we continued on the project, we needed to focus our attention on performance and resilience, as Joe’s lockdown workouts and PE sessions were bringing a lot of excitement. We identified that a standard part of a distributed system is messaging and queueing between services, and that we had an opportunity to optimise our initially naive implementations for emailing users as well as our recording of data with third parties for subscriptions and consents.
Some of our third parties use an asynchronous webhook-based flow from which we might expect spiky traffic patterns depending on outside factors, while other providers with synchronous flows presented challenges when faced with lots of traffic (which we proved closer to launch when running load tests). It was clear we needed to protect our main services from those kinds of challenges. Using AWS’s managed services like Simple Queue Service (SQS) and Simple Notification Service (SNS) we were able to easily set up fire-and-forget messages and dead-letter queues with retry logic, while offering quick responses to the client making API calls.
The other core subsystem where queues were used was emails. There were many that needed to be sent out - authentication, information about your plan, reminder that your subscription is expiring, etc. While we leveraged AWS Simple Email Service (SES), emails by nature can be a bit slow to send. This is doubly true for emails that require attachments. Rather than having a whole host of Lambdas each trying to interact directly with SES, we brought in two SQS queues. One for sending emails without attachments and one for handling those with attachments. Then any Lambda that needed to send an email simply dropped a message into the queue with the email template name to use and any personalisation information. That way, only the Lambdas that consumed the messages from the queues needed to directly access and know about SES. This provided resiliency, allowed us to control message priority, gave us the option to batch process, created better separation of concerns and useful abstractions, and allowed us to control the volume of SES calls. Now, whenever a new feature requires an email, it’s a straightforward process to implement with a minimum of new code.
Live streams
While much to do with live streams was an evolution of the video-on-demand we had already built for the main training section of the app, knowing when the live streams were actually live was quite a different problem.
 Screenshot from the Sprint 14 Review
We needed a solution that could scale enormously, be extremely reliable, and very cost-effective. After exploring multiple options (GraphQL subscriptions, background push notifications, etc.), we settled on quite a straightforward approach. Shortly before the live workout is scheduled to start, the app enters a local, virtual waiting room. This has no bearing on the backend and the experience is completely localised to the app. At this point, the app begins polling our backend.
To make this cost-effective and scalable, we serve a trivial JSON file hosted in an S3 bucket fronted by a CloudFront CDN that describes whether the stream is live or not. This CDN has an incredibly short TTL of only two seconds. However, it still results in an over-85% cache hit rate. There are no API Gateways, Lambdas, etc. involved in this polling process - just S3 and CloudFront. This ticks all our boxes of something that can scale enormously (and globally!), is extremely reliable, and very cost effective. At that point, we simply needed to respond to the server-to-server notification from Brightcove, our CMS and CDN for video content, to adjust our JSON file to show that the stream is now live.
Last months before launch: Improving observability
With just a short time before launch, there was a lot of excitement and lots of questions being asked. Joe Wicks name was on nearly everyone’s lips in the UK. We were confident in the big, beautiful, complicated product we’d built in quite a short space of time, and we’d run a successful beta programme, but how will we know if our system is healthy and handling scale? How can we identify where there are issues?
We spent time doubling down on our tooling for identifying and debugging errors: an AWS Hosted ElasticSearch (ES) Cluster with Kibana provided a place for us to ship our CloudWatch Logs from Lambda Functions. We added some tooling into Lambda Layers and wrapped our Lambda handlers to make our error and info logs consistently structured and even more useful when being indexed for search purposes in ES.
Another useful tool we set up was Grafana. We configured the deployment securely and simply on AWS Fargate (for managing containers) using only the official Grafana Docker image and environment variables. We created a Terraform module to set this all up. The value of Grafana is all about being able to easily create complex and beautiful visualisations and dashboards using data from a range of sources. After we’d got a good feeling for what an acceptable level of service is, we then templated and set up monitors for all our key user journeys. Most of the data came from AWS CloudWatch Metrics for Lambda, RDS, and SQS. We were also able to integrate ES data and even SQL queries on our RDS data store, to track trends in user data as well. (Important to note that AWS’s managed Grafana service was not available at the time we were building out our monitoring solution and therefore was not an option.)
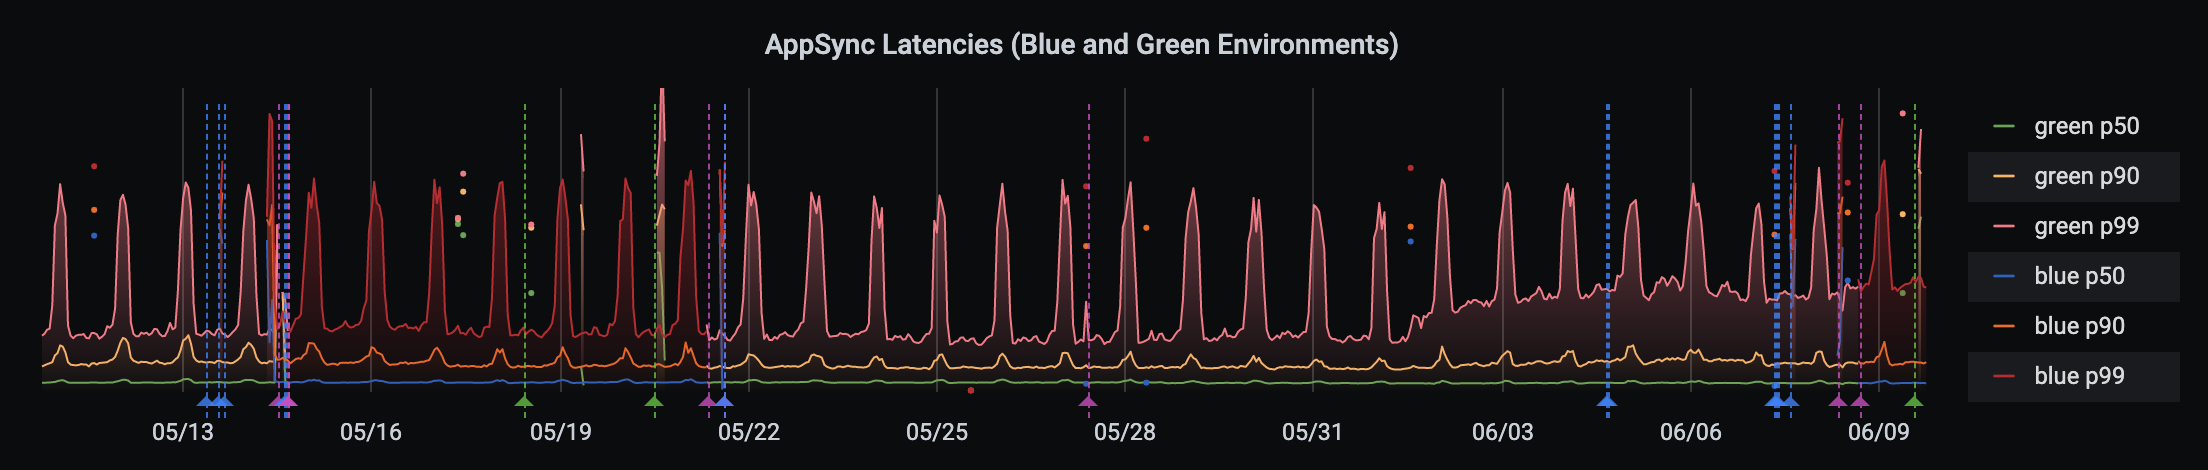 Monitoring latencies of our blue and green production environments for the core AppSync API. The vertical lines annotate, amongst other things, the cutover points between the two environments. Data is shown from May and June 2021.
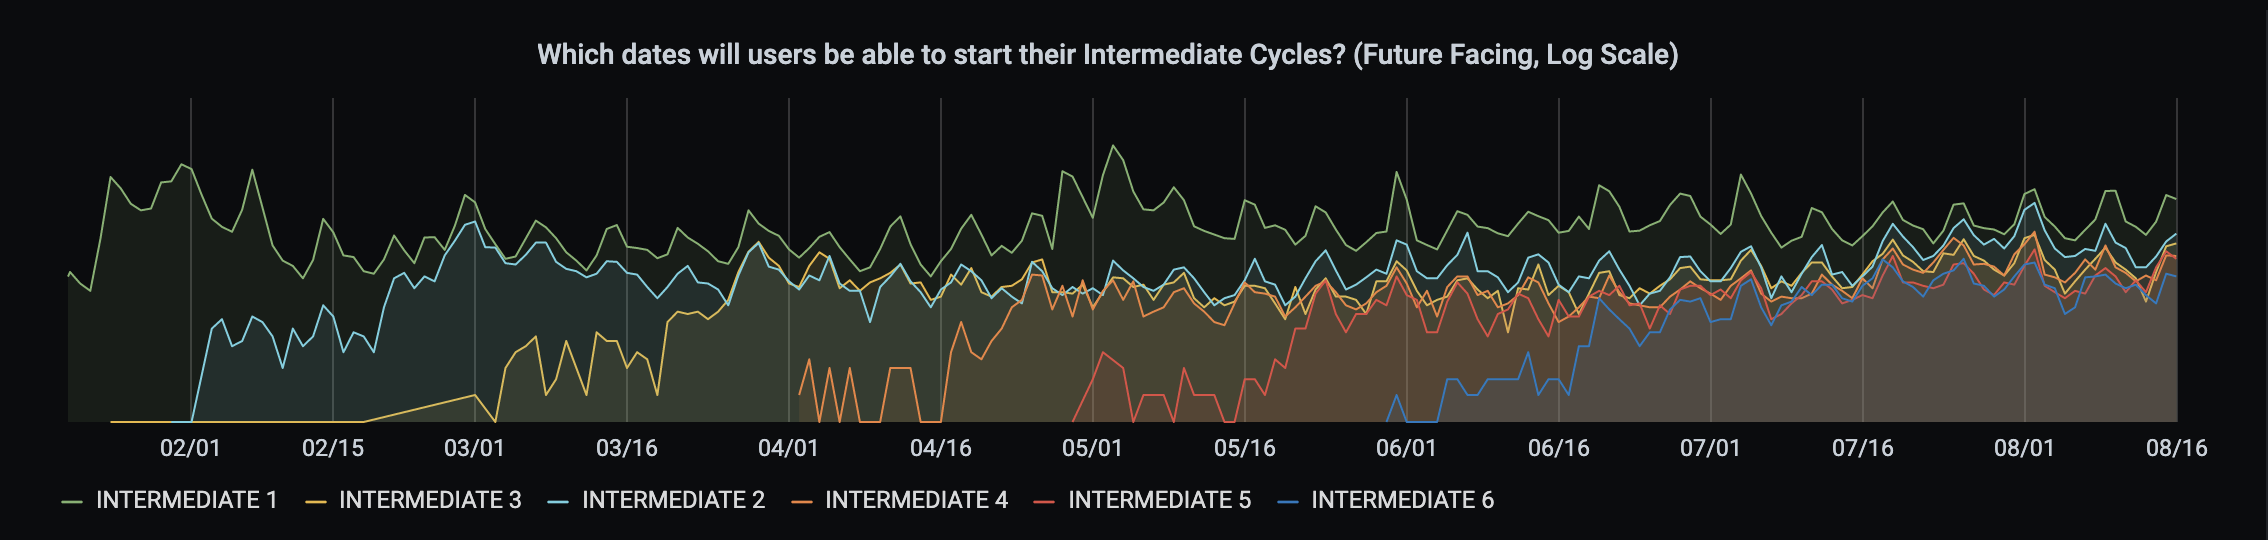 Tracking when users (and at what volume) would be eligible to start the various intermediate cycles on their plan. Each user spends four weeks on a cycle before they are eligible to check-in and move to the next cycle on their plan. Data is shown from February to August 2021.
Some may ask, why wasn’t this set up from the very beginning of the project? We practice the philosophy of only building systems when you need them. Obviously we’d need it before going live in order to ensure the reliability of the ecosystem, but we started building this out about mid-way through the build process and expanding it throughout the run up to launch. The primary motivation for starting to build it was that we had a system complex enough that the built-in monitoring and logging you get out of the box with AWS CloudWatch and the like was no longer sufficient. At that point, the mid-term need became an immediate need,so we started to ramp up our monitoring and alerting tooling.
On-call support
In advance of going live, we also worked with The Body Coach to bring on another partner - Just After Midnight (JAM). They provided (and still do at the time of writing!) 24/7 on-call support to ensure the service is always running smoothly. As we’re not running classic physical or virtual servers in our architecture, some of the traditional problems of keeping a service operational don’t exist. However, it’s equally false to assume that our architecture can never fail. It’s simply that it has different potential problems. We’ve built in resilience to the extent that is practical but you can still hit AWS service quotas, have timeouts at various points of the application, etc. Continuous observation and on-call management is still necessary to ensure there are no prolonged outages.
As part of this work, we integrated both our use of AWS and our alerting and monitoring tools to tie in to JAM’s PagerDuty instance and related tools.
Going live
As time ticked down to Day 0, things were at a fever pitch and we had a high degree of caution around any changes to our production system. Our focus was not so much on pushing new features and more on prophylactic changes to the architecture.
As an example, we implemented Amazon RDS Proxy to help us scale the number of simultaneous write connections our Aurora cluster could handle as well as significantly reducing the need to constantly establish new database connections. This again followed our pattern of only building out functionality or infrastructure when it was needed and not before.
During the final sprints, we were deploying to production on a near daily basis. Small, incremental changes each time, but the heavy use of deployment automation established early in the project gave us both the speed and confidence to do this. This continued even after launch as the final moderate bugs became apparent that hadn’t been caught in our earlier testing, beta or load testing.
In December (Sprint 19 of the project to be exact), we finally launched the app in the UK and Ireland and across much of Europe. It took us about nine months to go from zero lines of code to a brand new functional, scaleable, digital ecosystem for The Body Coach. After the release of a few more features and other enhancements, we then rolled out to parts of Oceania in March 2021.
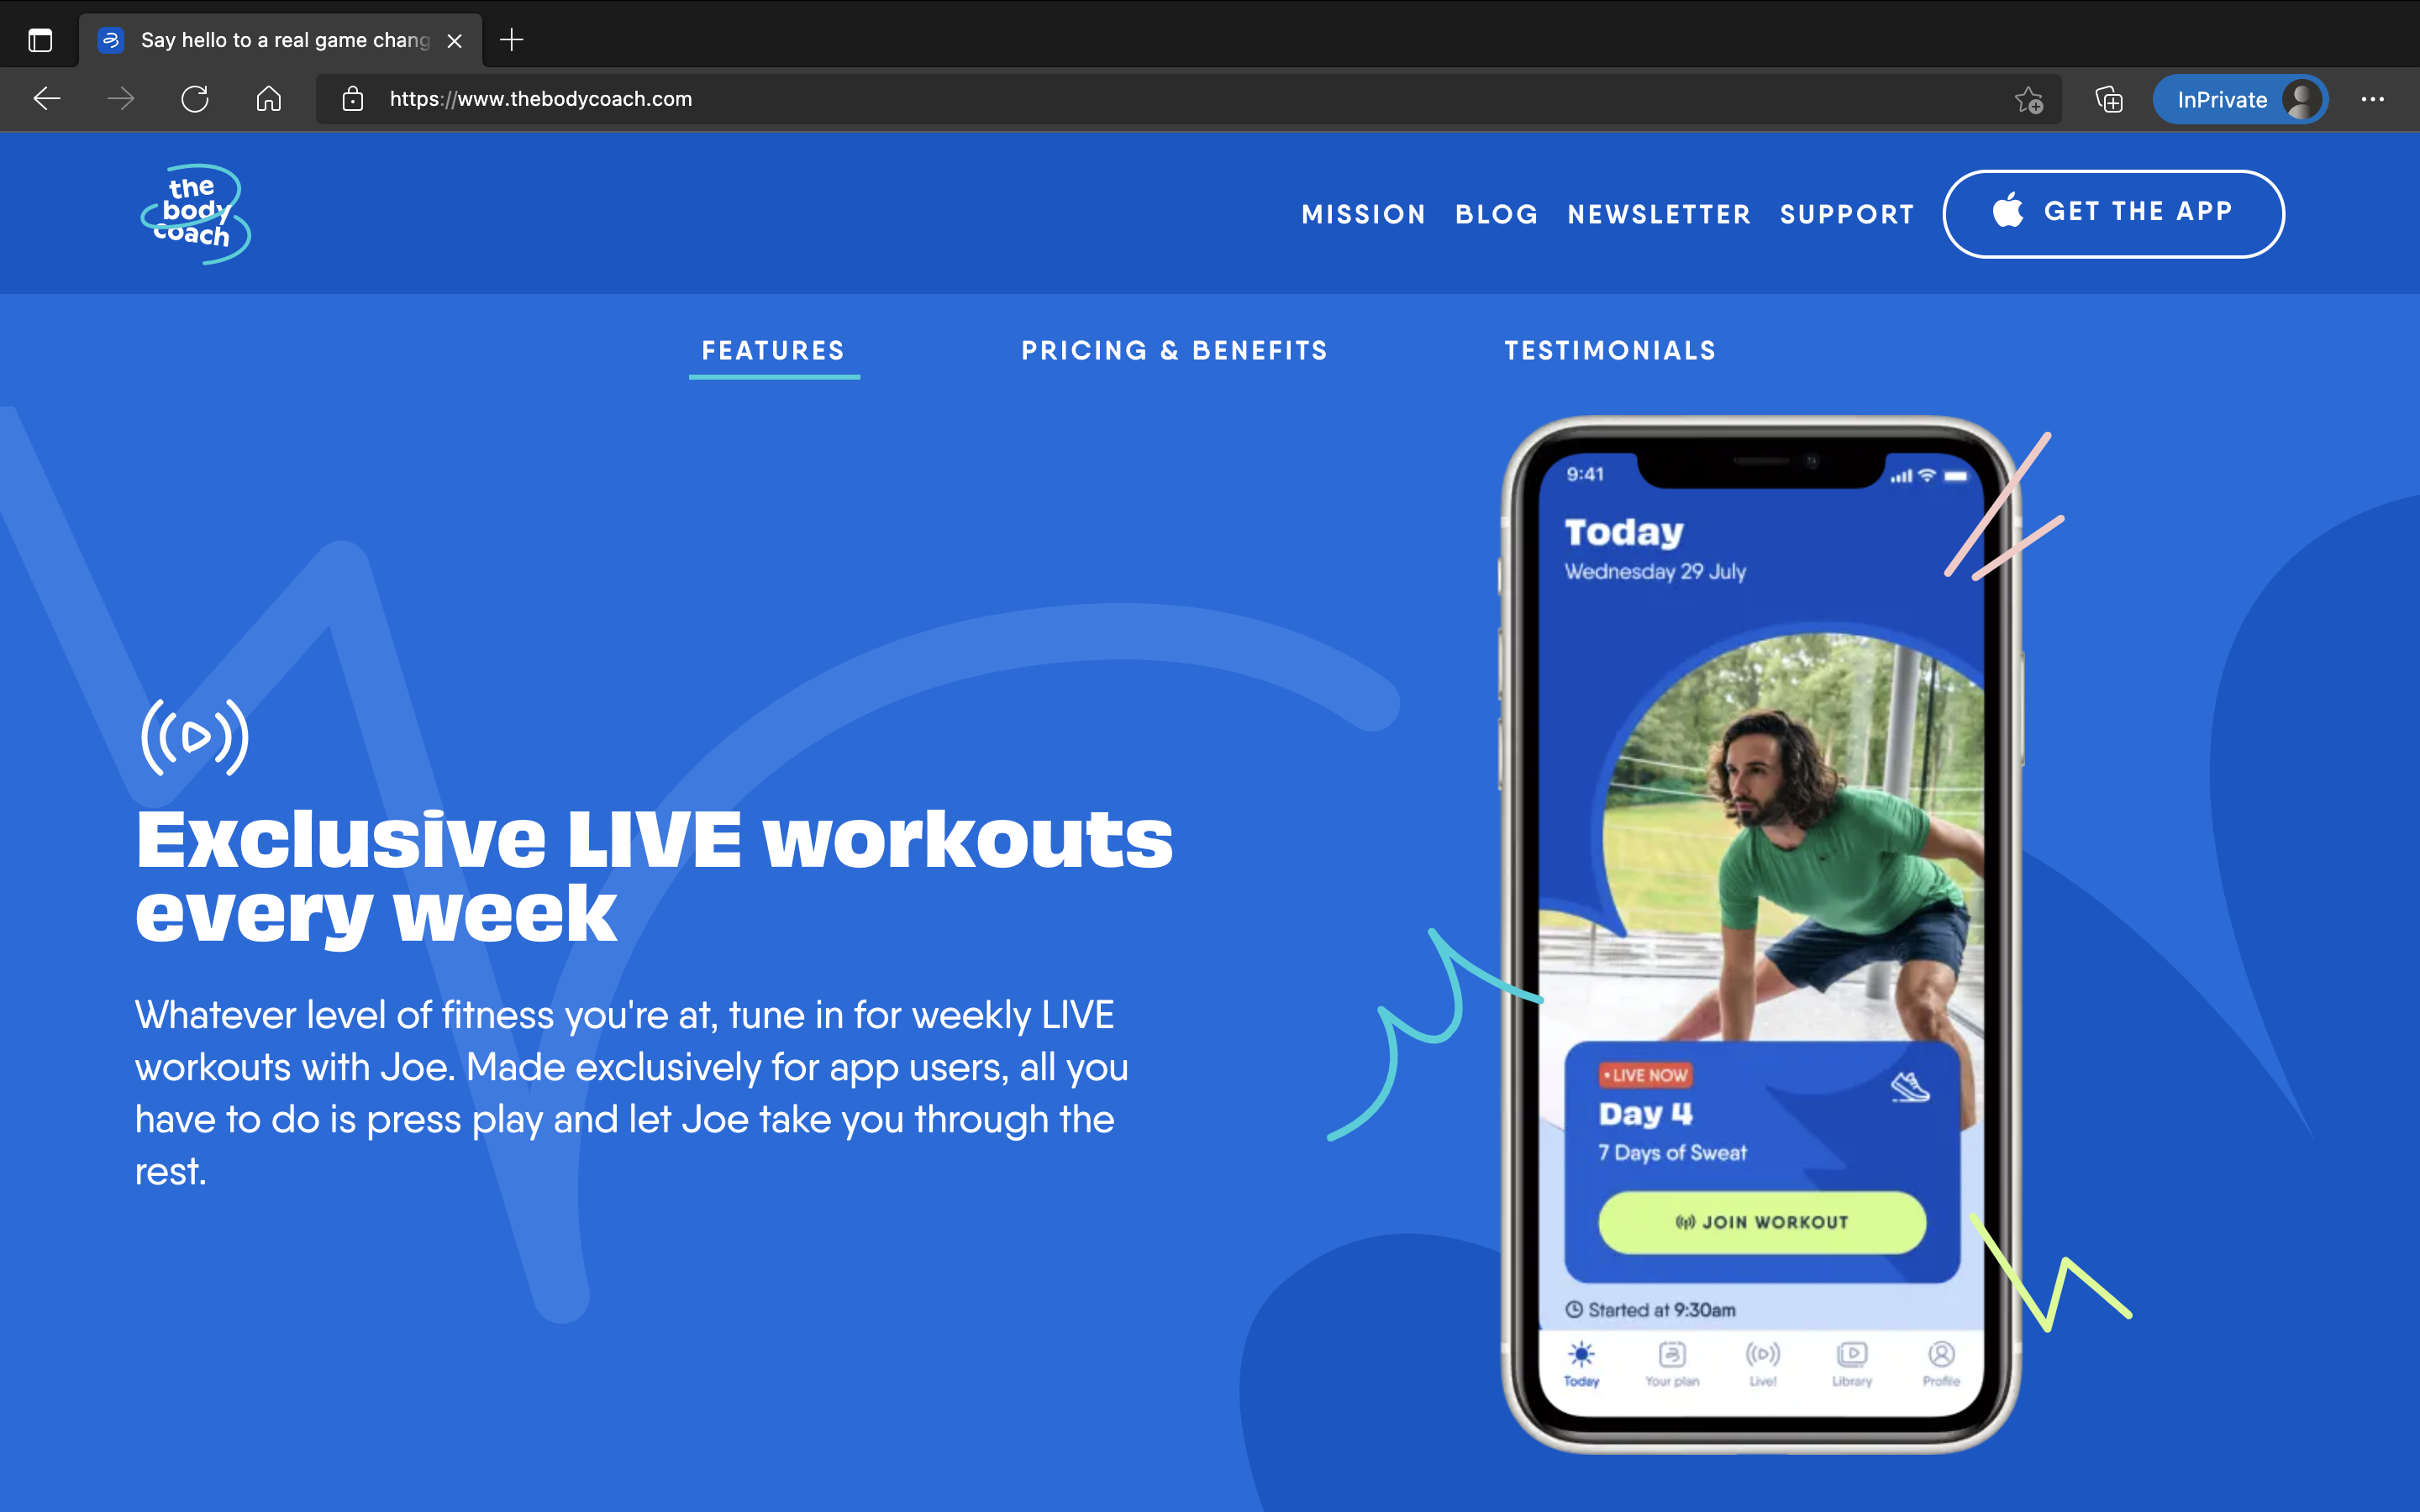 Screenshot of https://www.thebodycoach.com also showing the current version of the app, taken in July 2021.
Statistics
It is often hard to get a sense of scale or load that a technical system is under by simply looking at it from the outside or reading about it in generic terms. We’d like to share a few technical statistics to help you get a sense of where things are at today. All of these numbers were taken in late July 2021, a little over half a year after launch.
The system typically handles between 100k and 125k requests per hour at peak from the app alone. The combination of traffic from the app, the websites, and our third-parties results in about 150k to 200k Lambda invocations per hour at peak.
GitHub’s CEO Nat Friedman recently tweeted in June 2021 that they serve about 2.8 Billion API requests per day. To compare, The Body Coach app generates about 1 to 1.25 Million requests per day on our core backend (excluding all the video streaming and the like). While we’re nowhere near GitHub’s level (yet!), that’s still quite a non-trivial amount of daily interactions.
That’s an important distinction between The Body Coach and many other digital products. It is meant to be used not only daily by every user, but multiple times every day as we’re supporting both workouts and recipes for three meals a day (plus snacks!), seven days a week. Even without Joe Wicks and The Body Coach’s brand and mindshare within the world at launch, it wouldn’t have taken a large number of users to start putting a decent amount of load onto the system. But with the incredible build up prior to launch, we knew it was going to be big, so designing a scalable system was essential. And that has been a demonstrated success.
What’s next
What’s next in terms of The Body Coach’s digital ecosystem? Lots! There are many new features to implement, markets to expand to, and platforms to add. We can’t share anything just yet, but expect more insights as we continue to help The Body Coach grow and evolve.